
All Draw Curiosity videos are fully subtitled in English and Spanish. The blog post builds on the concepts touched upon in the video
I wasn’t planning on making a video this week as I often aim for a new episode every 2-3 weeks (and I’ve already got a fun in-depth episode in the works for next week, I’m preparing myself for naukas and of course, also working on my PhD), however the challenge of concisely explaining vision science in response to a tweet inspired me to make this episode of Snippet Science – which rapidly devolved into me making a classic length episode:
@InesLauraDawson Erm! Help? ? Can you explain this visual peculiarity please? ? Thanking you in advance! ? @TetZoo https://t.co/QuscDoiNN5
— Yes I’m a bit geeky! (@DGittins1) 12 de septiembre de 2016
However, I know some people will be interested in finding out a bit more about this fascinating illusion – so I decided to go into a bit more detail here. Also, special thanks to Will Kerslake who also passed on the following excellent paper. I like being able to cite primary sources, but I admit that given I’m trying to work quickly today I would probably be only referring to appropriate textbooks had this not been sent along:
@InesLauraDawson @DGittins1 @TetZoo Source paper https://t.co/A5teu9qFC8
— Will Kerslake (@wkerslake) 12 de septiembre de 2016
I think what I’m trying to say here is:
- Thanks for asking me science questions!
- Thanks for sending me science papers!
- Thanks for inspiring me to make additional Draw Curiosity episodes
- Thank you for 10,000 subscribers! (which happened last night!)
And now – to the science of this illusion!
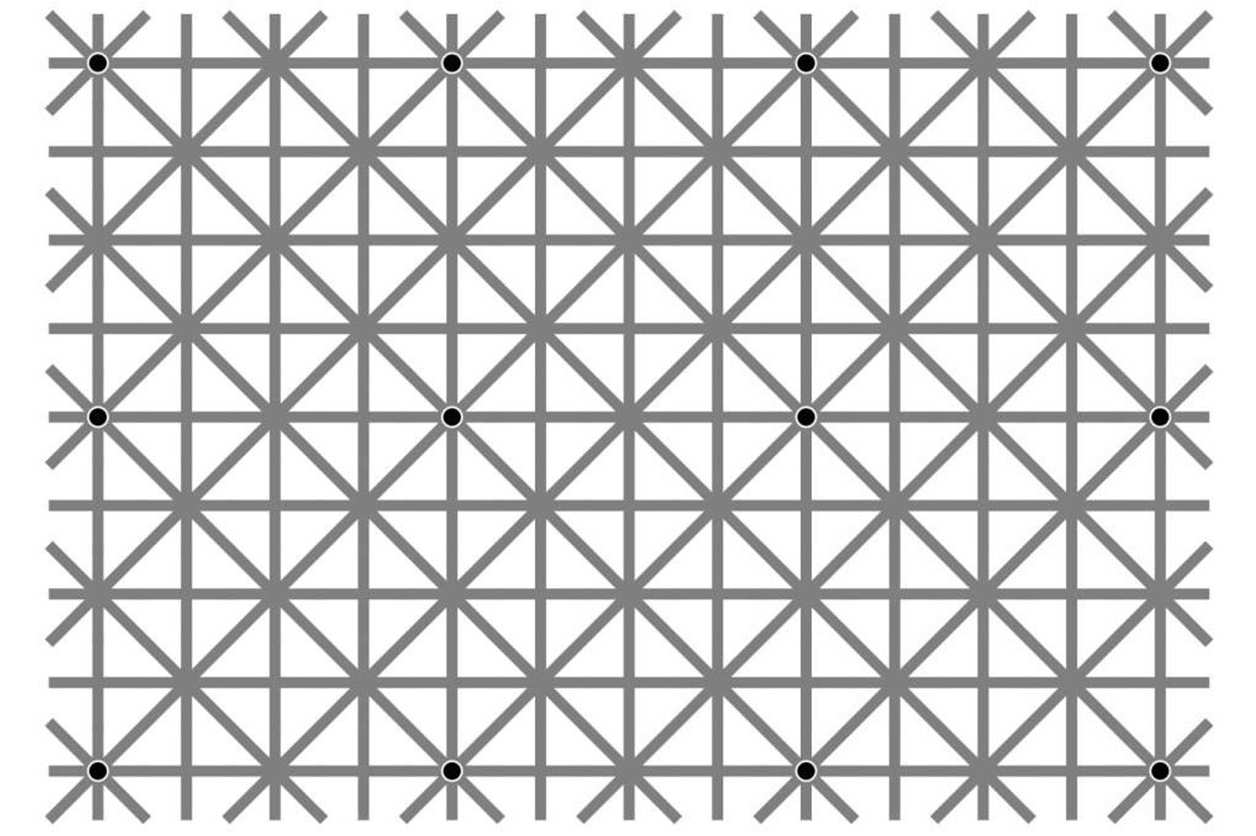
The illusion
By Japanese psychologist, Akiyoshi Kitaoka:
Incidentally, his website features a whole host of visual illusions beyond the Extinction illusions I explain here – do give his website a gander!
It’s not the first illusion of this type
When I first saw this grid, it immediately reminded me of a variation of the Extinction Illusion or Hermann’s grid, and I wondered whether it was playing on the same principles (SPOILER ALERT: it does).
The fascinating thing is that this grid can be manipulated and transformed in many manners, and it is still effective – from inverting contrast, varying the geometry of the grid, depicting circles in the intersections to generate a scintillating effect… The illusion we are playing with today is a combination of such transformations – and it’s particular striking. I would recommend the paper linked above by Ninio “Variations on the Hermann grid. An Extinction Illusion” to see some wonderful figures on how farfetched these variations can be, and for the illusion to still be effective.
In fact, the triangulated grids are thought to produce an even stronger effect than the rectangular grids, likely because there are more contrasting lines converging onto the intersections, thus making the effect of lateral inhibition even stronger.
What is Lateral Inhibition?
Lateral inhibition is the inhibition of neighbouring photoreceptors when a focal photoreceptor receives a photon. It reduces the information processed by the brain and aids in edge detection. The way it works is much like an unsharp mask in digital image processing, as noted by researchers Stocco and Lebiere in “Inhibitory synapses between striatal projection neurons support efficient enhancement of cortical signals: A computational model”. In spite of its name, an unsharp mask sharpens an image by giving the appearance of a higher resolution image. In short, it does this by taking gradients of colour corresponding to edges and enhancing their contrast. An edge with a soft gradient appears blurry, whereas a short sharp gradient gives the impression of higher contrast, and thus, higher resolution. Of course, it is impossible to reinsert detail that wasn’t detected in the first place, but this mask gives the illusion of a high resolution image, which is exactly what our brain is doing with the input it receives from our peripheral vision!
Why is our Peripheral Vision so poor?
Poor might be an overstatement, most animals have a region within their eyes where vision is more specialised and has higher acuity. In many herbivores, this area is generally horizontal. In our case, it’s a focused spot known as the fovea, where the highest concentration of cone photoreceptors is found (almost 200000/mm2). The fovea is a small dome shaped indentation in the centre of macula, which is about 5mm across. Macular vision also has a high density of cone photoreceptors, of around 100000/mm2. The density of cone photoreceptors drops down to less than 10000/mm2 as you leave central vision. The density of rods does increase, but not sufficiently to provide the same level of resolution as our cones in the macular area do. It would be very energetically expensive to process signals from so many cones, and it would also be expensive to process in the brain whilst also supplying a near live image. As such, our setup provides the perfect balance between a central focal point, and a light and motion-sensitive periphery, allowing for quick reaction times if necessary. Our distribution of cones and rods also presents a compromise between good colour daylight vision and a degree of nocturnal vision.
How do I know I’m not going blind?
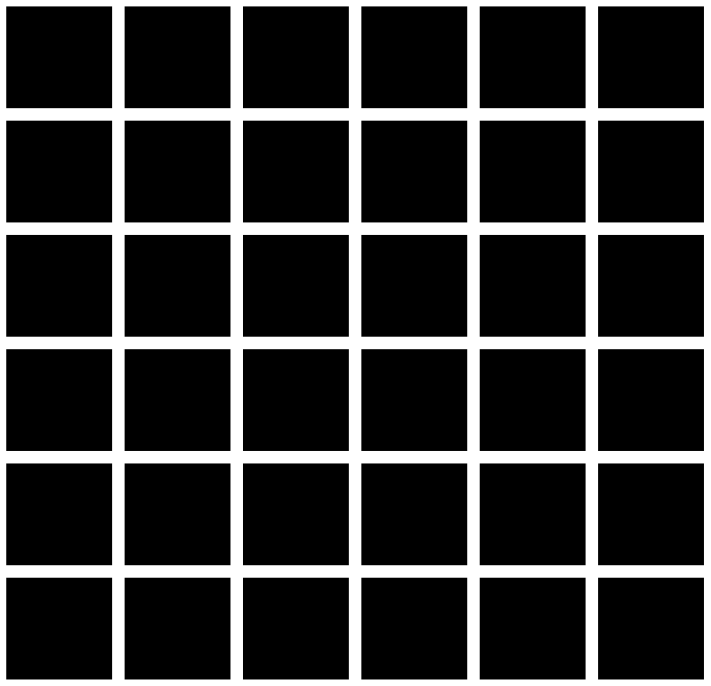
There will be someone watching who is concerned by me stating “our brain is so good at filling in the blanks that people who start to lose their peripheral vision don’t often realise as the process begins“. Whilst it is true that peripheral degeneration is generally gradual and people often realise after losing a surprising portion of their functional vision (for instance, after bumping into things, not noticing people out of the corner of their eyes, or having near misses whilst driving!), there are easy tests to detect it. The Amler-Fields test is the one most commonly used to diagnose a functional field of view in each eye. It is a large grid with lights that covers the entire field of view, with a cross in the centre. The person testing their vision is asked to fixate on the cross with one eye, whilst different lights are randomly flashed across the grid. The person then reports the lights they detect, and repeatedly undetected lights in the same area are likely a sign of a lack of perception in that area. It’s a very simple test and can provide an accurate map of functional vision and field of view.
I hope you enjoyed and learned something new today! Let me know what you think in the comments – I would love to know! If you enjoyed this blog and would like to be notified of new entries, consider signing up to the mailing list here and subscribing to the YouTube channel!